Tenant Analytics
Analytics
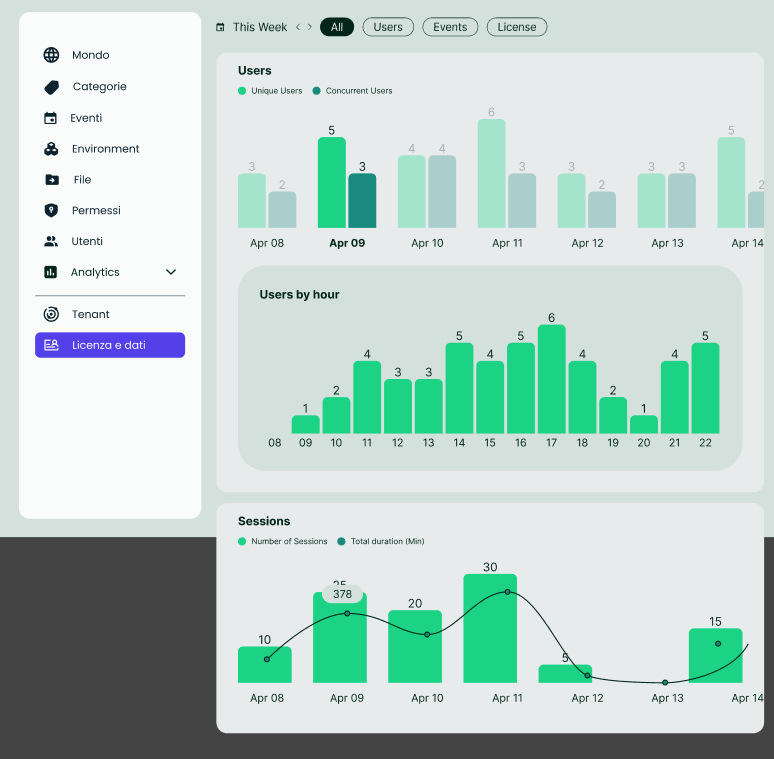
The Analytics section displays visual insights into user activity:
- Daily Users: A graph showing the number of unique and concurrent users each day within a selected week.
- Hourly Users: By selecting a specific day, the Tenant Manager can view user activity by hour to identify peak usage times.
- Sessions: A chart displaying the number of sessions and the total duration of user activity for each day, helping monitor engagement trends. The Tenant Analytics section in the back office provides the Tenant Manager with essential information regarding user analytics.